Hello, this is Tsutsumi from GO ASIA TRAIL.
In the previous article, I introduced a congestion simulation tool for trail races that I released on GitHub as open source, in a press‑release style overview. This time, I focus on a more concrete use case. Using real race data, I simulated how the number of participants affects finish rates and DNFs (Did Not Finish). The goal is to surface insights useful for both race organizers and runners.

Tool overview and purpose of this simulation
The tool takes a GPX file of the course as input and uses Monte Carlo simulation to model race progression while accounting for runner pace distributions, course gradients, and delays caused by congestion. It models slowdowns on single‑track sections where bottlenecks are common, and predicts overall times and DNF rates.
Since the initial release, I’ve added several updates, notably the ability to define checkpoint locations and cutoffs. This lets the model simulate DNFs more faithfully to actual race rules.
In this article, I use the 100 km course of “Kaga Spa Trail by UTMB,” held in June 2025, as an example. I compare the actual 1,200‑runner field with a hypothetical 500‑runner field to examine how the number of participants changes DNF counts. The GPX course data comes from the actual race, and the runner pace model is kept identical between the two cases, so we can isolate the effect of field size.
The tool and source code are available on GitHub. Feel free to fork and customize!
Simulation with 1,200 participants: the actual race
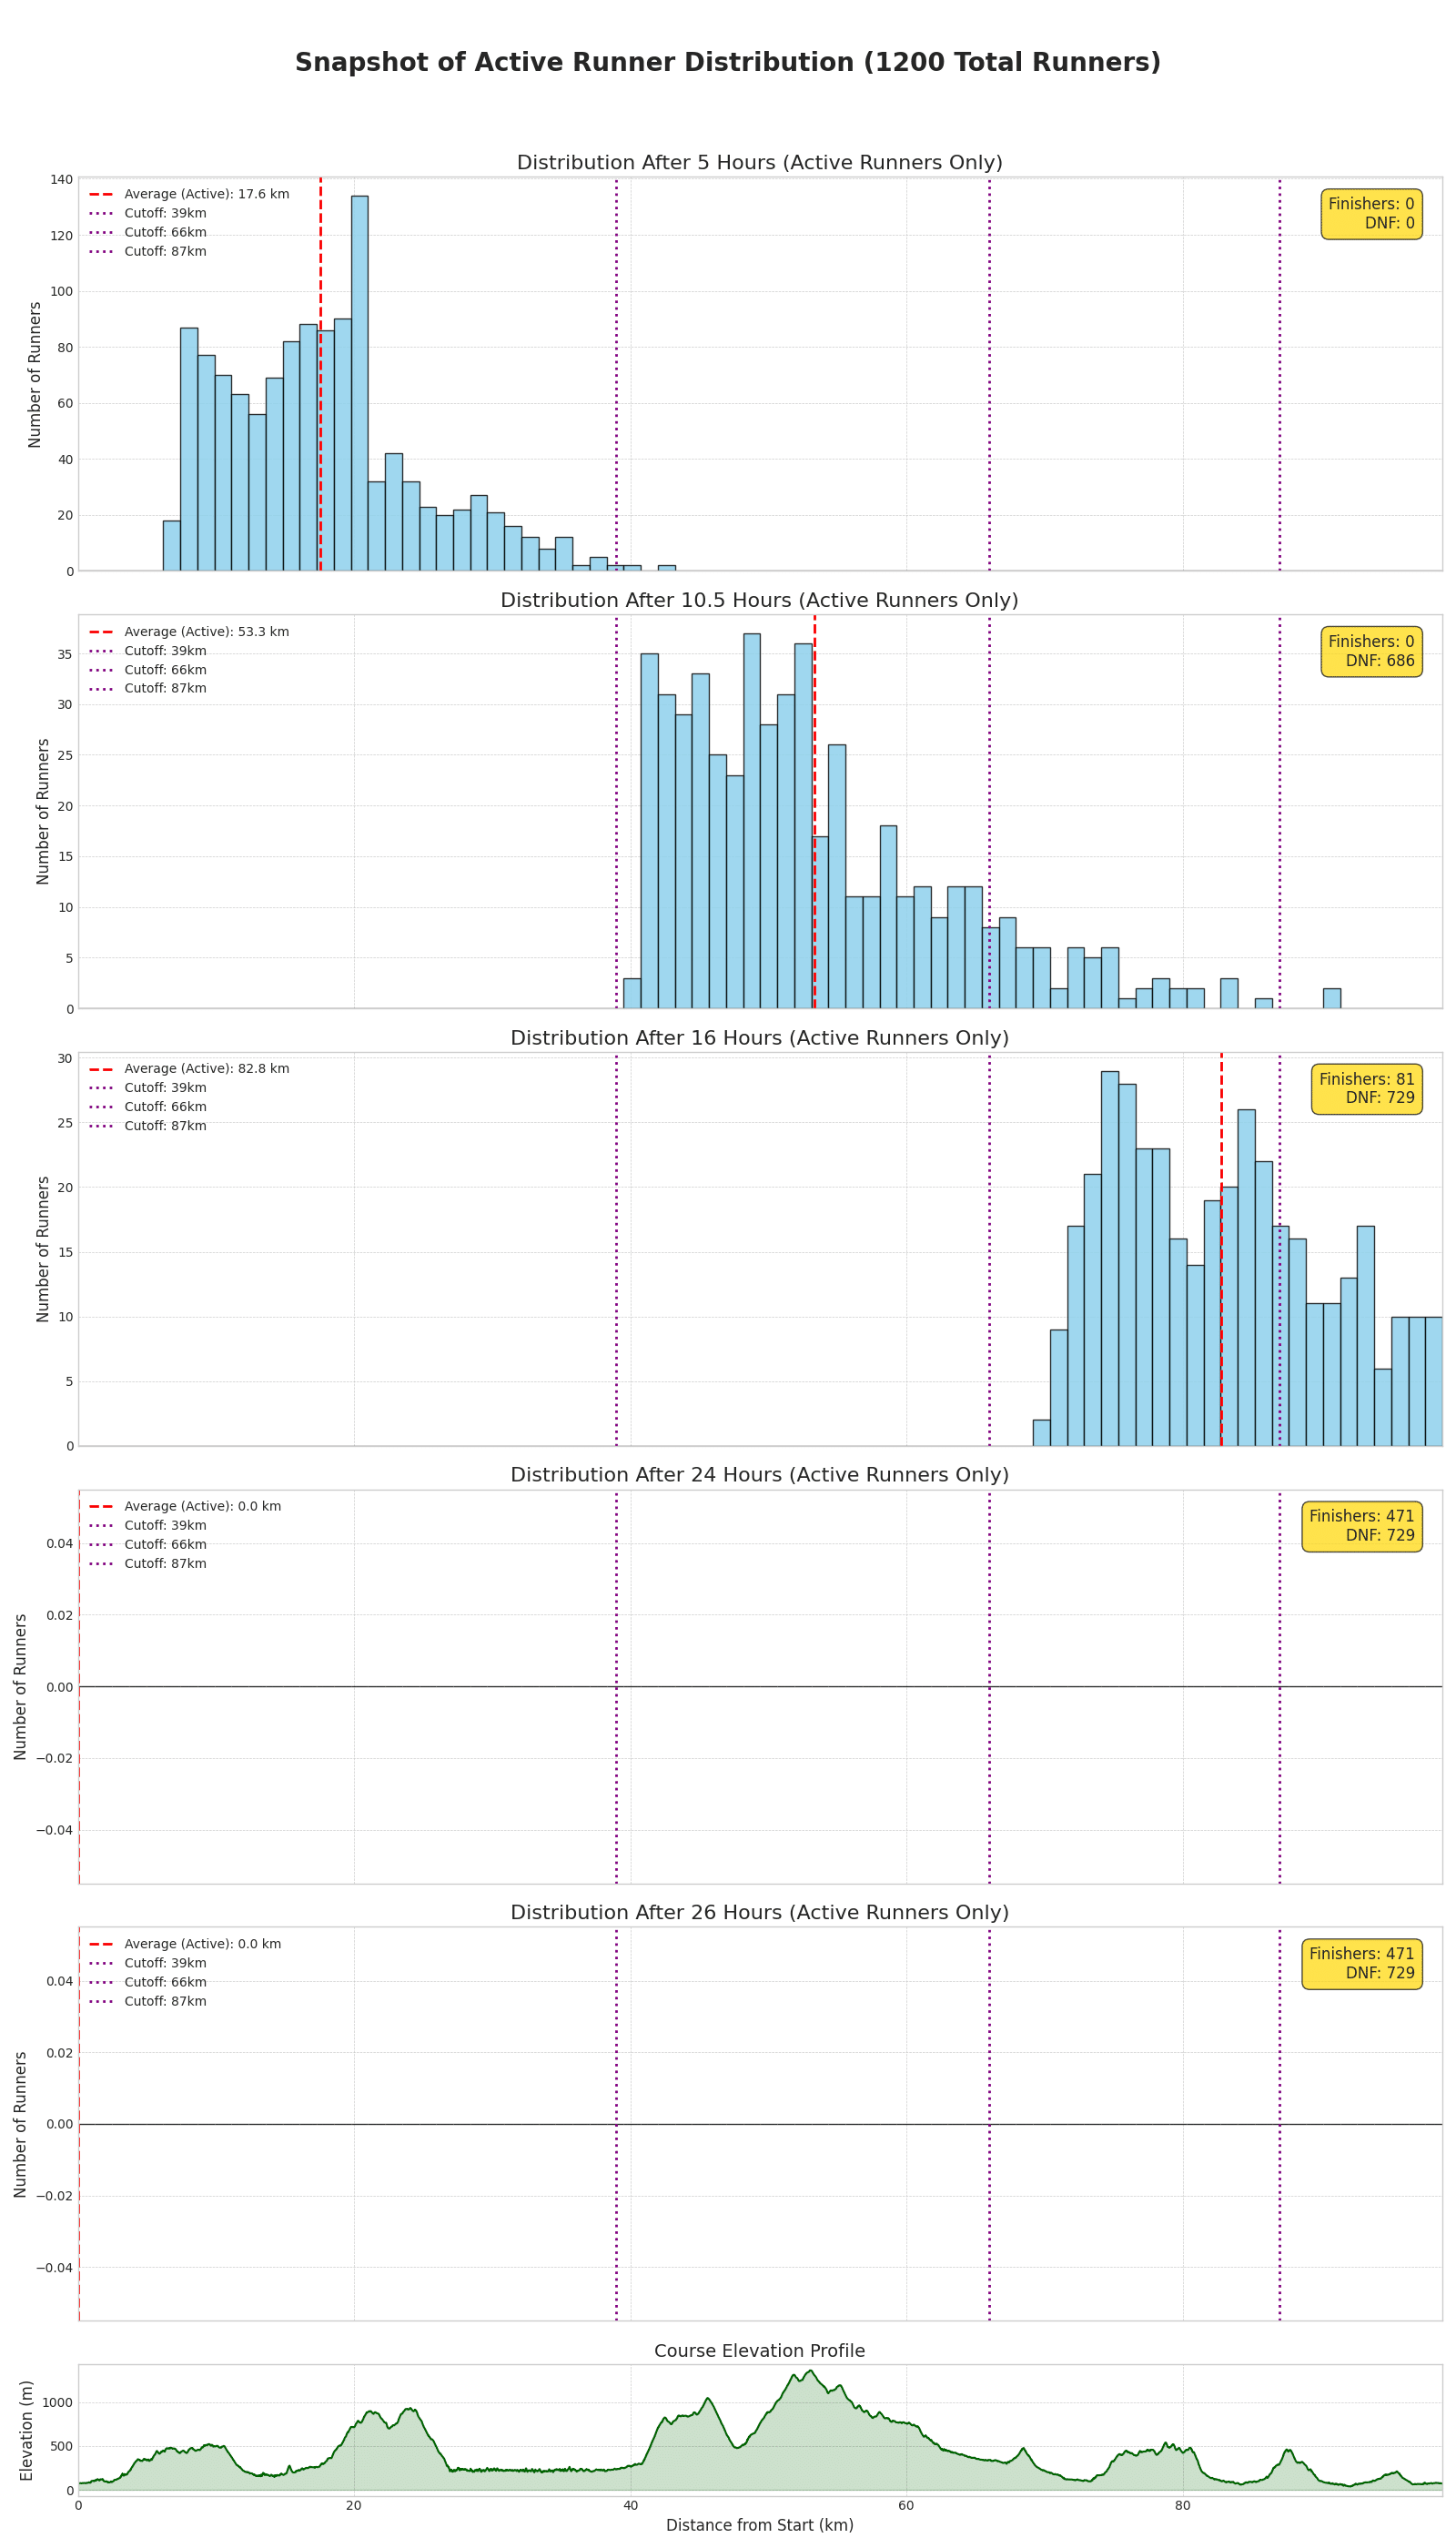
Let’s first simulate the actual field size of 1,200. The course is 100 km with the following checkpoint cutoffs from start time:
- At 39 km: 10 hours 05 minutes
- At 66 km: 16 hours
Results:
- By the 39 km cutoff: DNF 686 runners
- By the 66 km cutoff: cumulative DNF 729 runners
- Final DNF: 729 runners (finish rate about 39.2%)
In this simulation, over half of the field DNFs by mid‑race. The primary driver is congestion soon after the start and on single‑track sections, which prevents runners from maintaining their planned paces. For reference, large international races such as the UTMB main event typically see finish rates around 65–70%. The markedly lower finish rate here suggests the course capacity is insufficient relative to the field size.
Simulation with 500 participants: reducing the field
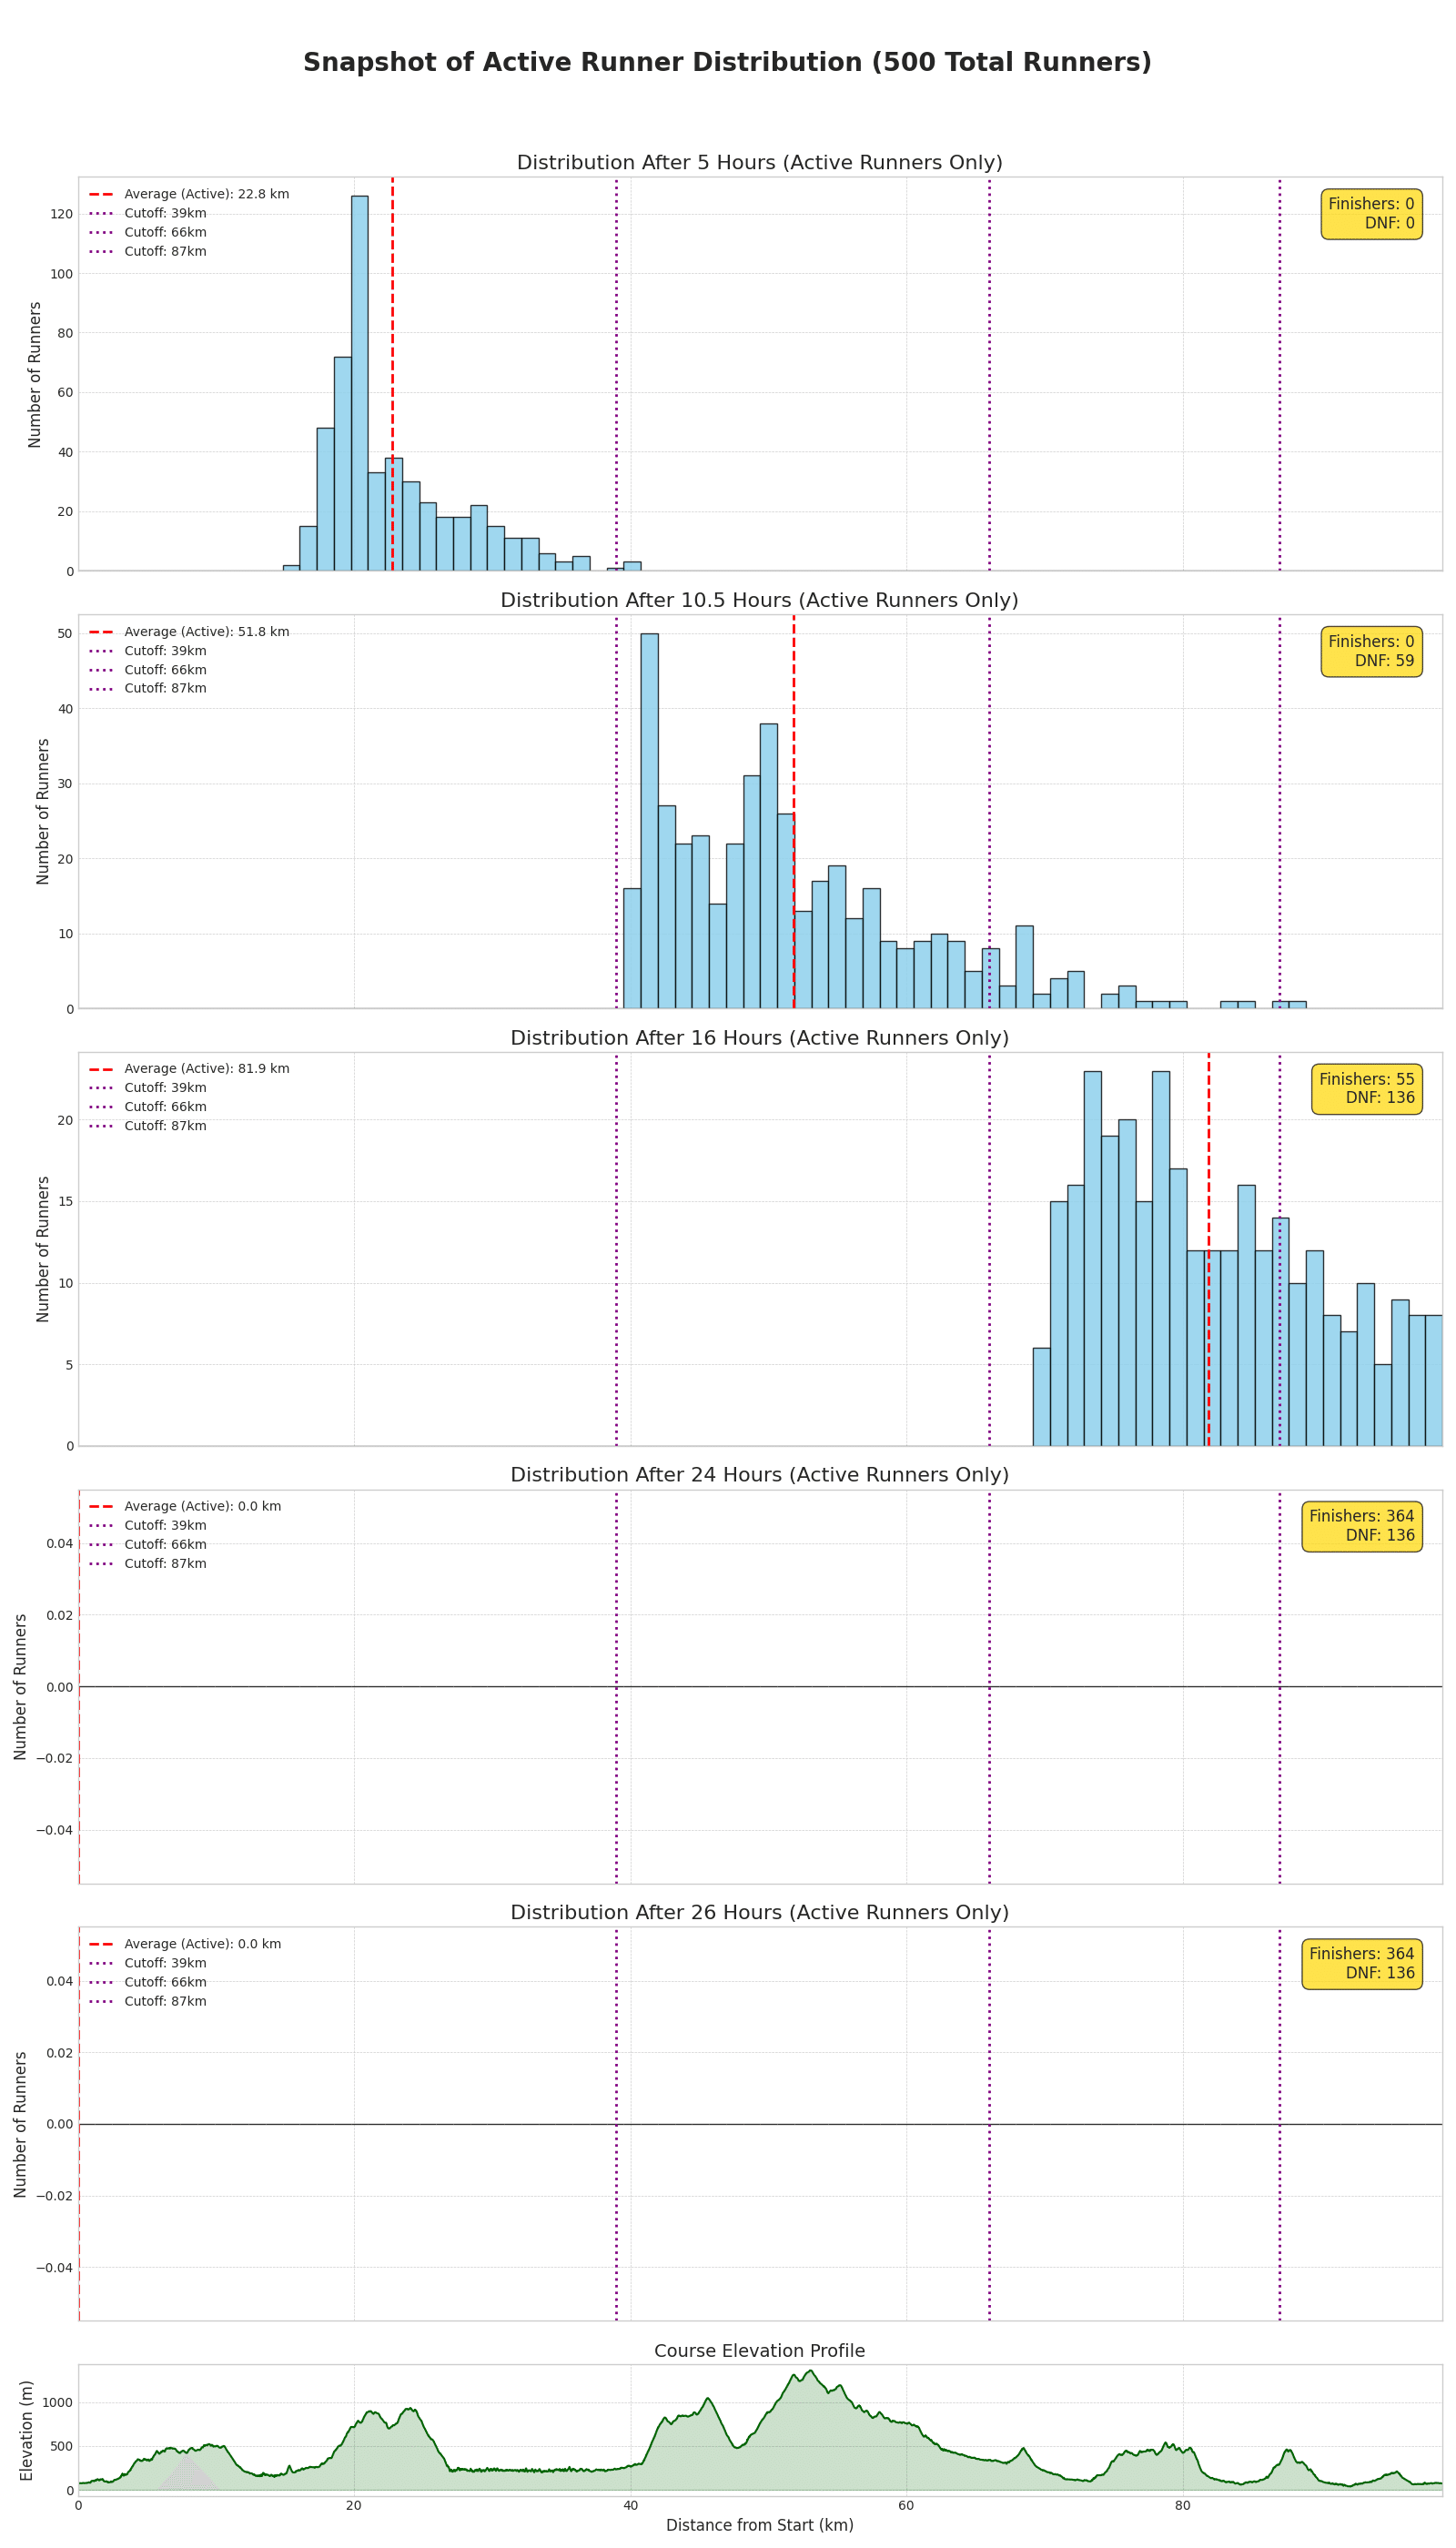
Next, I simulate the same conditions with the field reduced to 500 runners. The course and pace model remain unchanged; only congestion differs.
Results:
- By the 39 km cutoff: DNF 59 runners
- By the 66 km cutoff: cumulative DNF 136 runners
- Final DNF: 136 runners (finish rate about 72.8%)
This is a major improvement. Mid‑race DNFs plunge, and the finish rate approaches that of UTMB‑class events. With fewer participants, bottlenecks ease and runners can better maintain their own paces.
| Participants | DNF at 39 km | DNF at 66 km (cumulative) | Final DNF | Finish rate (%) |
|---|---|---|---|---|
| 1200 | 686 | 729 | 729 | 39.25 |
| 500 | 59 | 136 | 136 | 72.8 |
This comparison indicates that simply reducing the field size can boost the finish rate by more than 30 percentage points. In particular, the 1,200‑runner case yields 686 DNFs around mid‑course, which implies a significant transport burden for organizers to return runners.
If you think in terms of large tour buses, that’s roughly 13–14 buses’ worth of people. Realistically, organizers would shuttle 2–3 buses back and forth, but even then it can take hours to transport hundreds of runners, raising the risk of operational disruption on race day.
Benefits and conclusions
Key advantages of this simulator include the ability to forecast race risks on the planning desk:
- DNF forecasting and transport planning: optimize bus and shuttle resources based on predicted DNFs, improving safety while controlling costs.
- Adjusting field size: align the number of entrants with course capacity to improve finish rates and runner satisfaction.
- Course design improvements: identify congestion‑prone sections and consider bypasses or course revisions.
From the Kaga Spa Trail example, the low finish rate appears driven primarily by insufficient course capacity relative to field size. To host 1,200 runners, transport resources must be greatly expanded. More realistically, reducing the field is the rational choice. Iterating this analysis helps enable fairer, more enjoyable races.
Beyond capacity, there were also issues such as significant shortages of water and food at aid stations and financial concerns. That said, the aid shortages could be partially mitigated by reducing the number of participants.
Give the tool a try with your own race data. Feedback is welcome on GitHub. I may share further feature updates next time—see you in the next article.